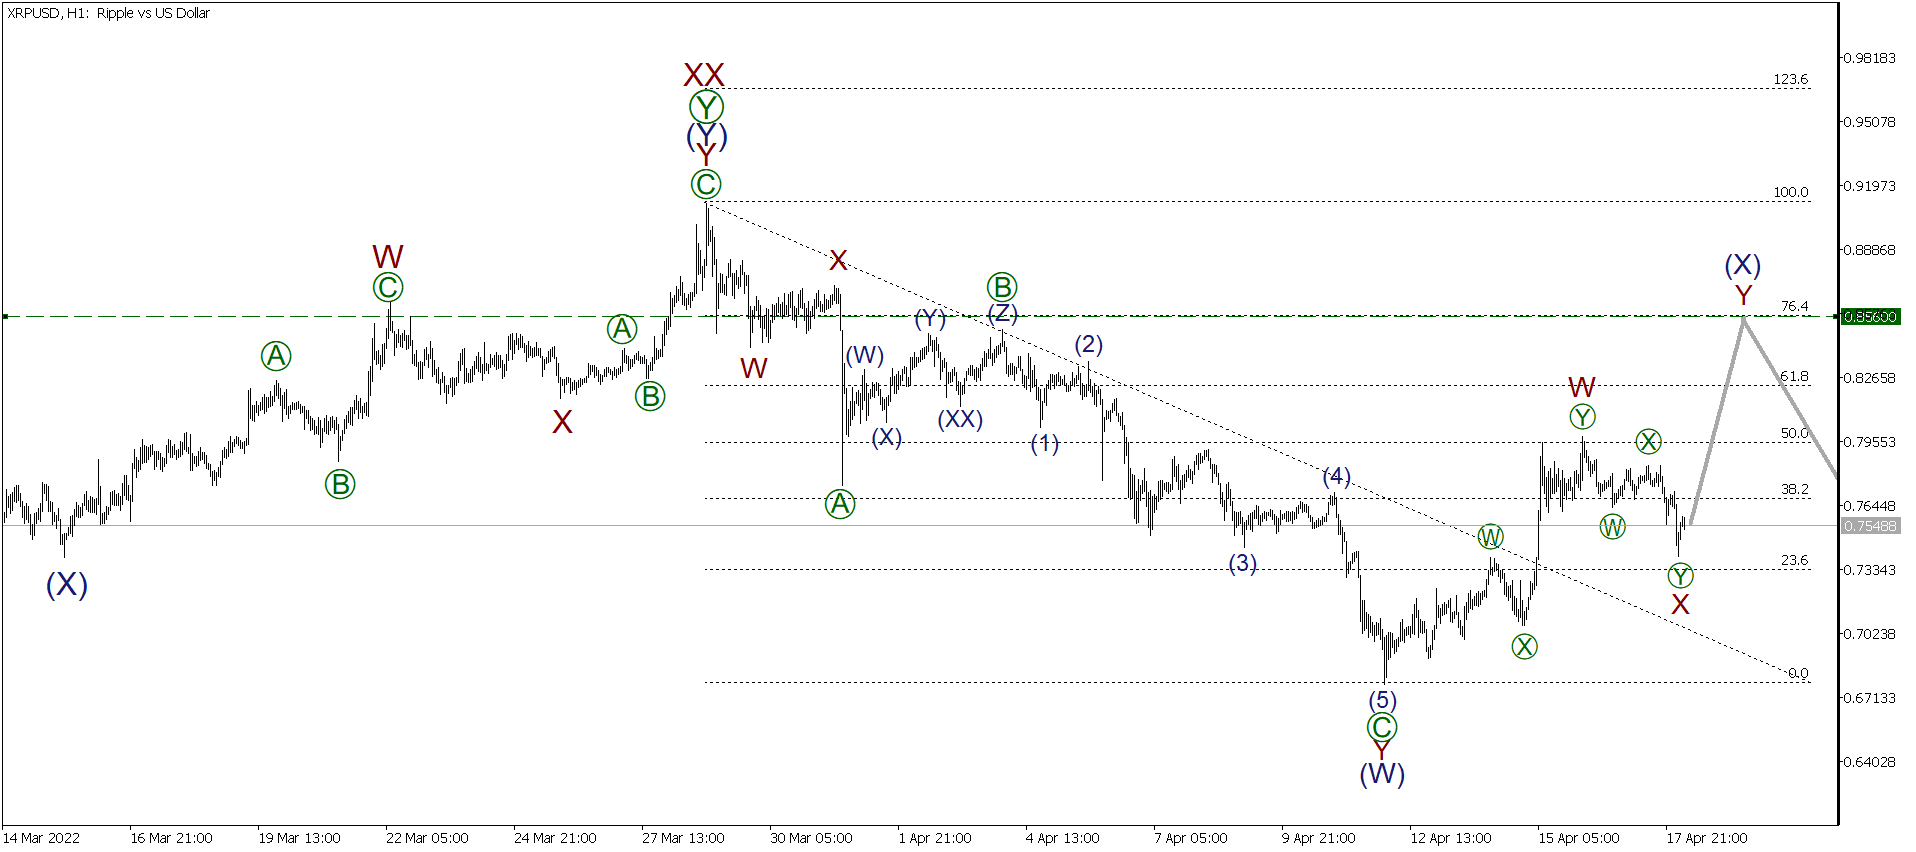
A downward corrective pattern is developing in the last part of the XRPUSD chart. It may unfold as a double zigzag (W)-(X)-(Y). The first actionary wave (W) is fully formed as a double zigzag W-X-Y. The bullish corrective wave (X) is developing at the moment; it may also unfold as a double zigzag W-X-Y. Most likely, the subwaves W-X are fully formed. They are marked as small doubles zigzags — subwaves [W]-[X]-[Y]. The price is expected to rise in the actionary wave Y in the nearest time and stop at the level 0.856, where the size of wave (X) will be 76.4% of wave (W).
Trading plan for XRPUSD for today:
Buy 0.754,
Take profit: 0.856.
Myanfx-edu does not provide tax, investment or financial services and advice. The information is being presented without consideration of the investment objectives, risk tolerance, or financial circumstances of any specific investor and might not be suitable for all investors.
Go to Register with LiteForex Platform
Financial Trading is not suitable for all investors & involved Risky. If you through with this link and trade we may earn some commission.